Menu
Share price€ 65,50 -2.09%
en
  • fr
  • nl
  • Aedifica
    • About us
    • Our portfolio
    • Corporate governance
    • Our team
    • Your career
  • Investors
    • Shareholder information
    • Press releases
    • Reports & presentations
    • Financial information
    • Debt information
    • The share
    • Capital increases
    • Optional dividend
    • Proposed exchange offer for Cofinimmo
  • Sustainability
    • Our commitments
    • Sustainable housing
    • Ratings
  • Our stories
    • Unlocking The Mount’s full potential
    • A flexible school building, custom made
    • A place like home
  • News
  • Contact
  • info@aedifica.eu
  • +32 2 626 07 70
  • Aedifica
    • About us
    • Our portfolio
    • Corporate governance
    • Our team
    • Your career
  • Investors
    • Shareholder information
    • Press releases
    • Reports & presentations
    • Financial information
    • Debt information
    • The share
    • Capital increases
    • Optional dividend
    • Proposed exchange offer for Cofinimmo
  • Sustainability
    • Our commitments
    • Sustainable housing
    • Ratings
  • Our stories
    • Unlocking The Mount’s full potential
    • A flexible school building, custom made
    • A place like home
  • News
  • Contact
  • Key figures
  • Consolidated accounts
HomepageFinancial information

Financial information

Key figures

  • €6.1bn portfolio value
  • €93m Q1 2025 rental income
  • 39.9% debt-to-assets ratio
  • €1.32/share Q1 2025 EPRA Earnings

Consolidated accounts

  • Download the consolidated income statement in excel
    (x 1,000 €)

    31/12/2024

    31/12/2023

    31/12/2022

    I. Rental income 338,138 314,174 273,132
    II. Writeback of lease payments sold and discounted 0 0 0
    III. Rental-related charges -157 -1,134 -1,589
    Net rental income 337,981 313,040 271,543
    IV. Recovery of property charges 3 0 0
    V. Recovery of rental charges and taxes normally paid by tenants on let properties 8,969 7,193 3,934
    VI. Costs payable by the tenant and borne by the landlord on rental damage and repair at end of lease 0 0 0
    VII. Rental charges and taxes normally paid by tenants on let properties -8,852 -7,205 -3,979
    VIII. Other rental-related income and charges 621 -90 355
    Property result 338,722 312,938 271,853
    IX. Technical costs -3,907 -3,169 -3,373
    X. Commercial costs -39 -58 -29
    XI. Charges and taxes on unlet properties -145 -114 -53
    XII. Property management costs -6,918 -6,452 -4,655
    XIII. Other property charges -1,552 -1,424 -1,110
    Property charges -12,561 -11,217 -9,220
    Property operating result 326,161 301,721 262,633
    XIV. Overheads -35,074 -35,740 -33,556
    XV. Other operating income and charges -831 -171 597
    Operating result before result on portfolio 290,256 265,810 229,674
    XVI. Gains and losses on disposals of investment properties 374 -856 787
    XVII. Gains and losses on disposals of other non-financial assets 0 0 0
    XVIII. Changes in fair value of investment properties° 15,195 -143,636 84,877
    XIX. Other result on portfolio -30,235 -26,072 -18,103
    Operating result 275,590 95,246 297,235
    XX. Financial income 971 3,006 1,606
    XXI. Net interest charges -46,701 -45,004 -30,651
    XXII. Other financial charges -5,176 -5,181 -7,194
    XXIII. Changes in fair value of financial assets and liabilities -18,708 -50,878 123,242
    Net finance costs -69,614 -98,057 -87,003
    XXIV. Share in the profit or loss of associates and joint ventures accounted for using the equity method -571 -256 2,168
    Profit before tax (loss) 205,405 -3,067 386,406
    XXV. Corporate tax -449 25,565 -54,345
    XXVI. Exit tax 135 54 -330
    Tax expense -314 25,619 -54,675
    Profit (loss) 205,091 22,552 331,731
    Attributable to:
    Non-controlling interests 260 -1,983 -47
    Owners of the parent 204,831 24,535 331,778
    Basic earnings per share (€) 4.31 0.56 8.71
    Diluted earnings per share (€) 4.31 0.56 8.71
  • Download the consolidated balance sheet in excel
    ASSETS 31/12/2024 31/12/2023 31/12/2022 31/12/2021
    (x 1.000 €)
    I. Non-current assets
    A. Goodwill 87,363 117,597 143,669 161,726
    B. Intangible assets 1,047 1,663 1,857 1,934
    C. Investment properties 6,117,932 5,790,357 5,619,701 4,861,062
    D. Other tangible assets 4,348 2,184 2,573 2,369
    E. Non-current financial assets 54,273 98,665 132,322 7,479
    F. Finance lease receivables 0 0 0 0
    G. Trade receivables and other non-current assets 0 0 0 0
    H. Deferred tax assets 823 3,023 4,662 3,116
    I. Equity-accounted investments 31,586 35,985 40,824 40,522
    Total non-current assets 6,297,372 6,049,474 5,945,608 5,078,208
    II. Current assets
    A. Assets classified as held for sale 100,207 58,158 84,033 35,360
    B. Current financial assets 0 0 0 0
    C. Finance lease receivables 0 0 0 0
    D. Trade receivables 19,526 23,290 23,577 20,434
    E. Tax receivables and other current assets 11,334 9,384 10,273 7,368
    F. Cash and cash equivalents 18,451 18,253 13,891 15,335
    G. Deferred charges and accrued income 16,934 18,252 8,158 5,162
    Total current assets 166,452 127,337 139,932 83,659
    TOTAL ASSETS 6,463,824 6,176,811 6,085,540 5,161,867


    EQUITY AND LIABILITIES 31/12/2024 31/12/2023 31/12/2022 31/12/2021
    (x 1.000 €)
    I. Issued capital and reserves attributable to owners of the parent
    A. Capital 1,203,638 1,203,638 1,006,881 917,101
    B. Share premium account 1,719,001 1,719,001 1,516,108 1,301,002
    C. Reserves 515,505 628,688 428,018 281,244
    a. Legal reserve 0 0 0 0
    b. Reserve for the balance of changes in fair value of investment properties 364,698 481,914 389,859 349,234
    d. Reserve for the balance of changes in fair value of authorised hedging instruments qualifying for hedge accounting as defined under IFRS 1,708 4,344 8,945 -12,784
    e. Reserve for the balance of changes in fair value of authorised hedging instruments not qualifying for hedge accounting as defined under IFRS 62,735 113,177 -11,193 -26,872
    f. Reserve of exchange differences relating to foreign currency monetary items 58 -294 -451 72
    g. Foreign currency translation reserves 33,471 64 -13,629 24,869
    h. Reserve for treasury shares -459 -31 -31 0
    j. Reserve for actuarial gains and losses of defined benefit pension plans -363 -244 -99 0
    k. Reserve for deferred taxes on investment properties located abroad -88,576 -112,367 -71,715 -24,696
    m. Other reserves -669 -3,277 250 3,015
    n. Result brought forward from previous years 136,099 136,909 117,023 87,532
    o. Reserve- share NI & OCI of equity method invest 6,803 8,493 9,059 5,894
    D. Profit (loss) of the year 204,831 24,535 331,778 281,824
    Equity attributable to owners of the parent 3,642,975 3,575,862 3,282,785 2,781,171
    II. Non-controlling interests 5,122 5,039 6,564 4,226
    TOTAL EQUITY 3,648,097 3,580,901 3,289,349 2,785,397
    I. Non-current liabilities
    A. Provisions 0 0 0 0
    B. Non-current financial debts 2,065,194 1,958,750 2,017,256 1,756,679
    a. Borrowings 1,263,111 1,166,915 1,240,399 959,522
    c. Other 802,083 791,835 776,857 797,157
    C. Other non-current financial liabilities 94,901 90,943 82,232 96,154
    a. Authorised hedges 10,922 9,760 3,858 33,326
    b. Other 83,979 81,183 79,374 62,828
    D. Trade debts and other non-current debts 124 251 375 500
    E. Other non-current liabilities 0 0 0 0
    F. Deferred tax liabilities 133,238 138,658 164,117 121,283
    Non-current liabilities 2,293,457 2,188,602 2,263,980 1,974,616
    II. Current liabilities
    A. Provisions 0 0 0 0
    B. Current financial debts 448,442 321,549 435,164 324,398
    a. Borrowings 134,392 78,949 172,164 48,398
    c. Other 314,050 242,600 263,000 276,000
    C. Other current financial liabilities 3,281 2,798 3,487 2,616
    D. Trade debts and other current debts 48,933 57,177 66,853 50,109
    a. Exit tax 1,400 44 5,990 298
    b. Other 47,533 57,133 60,863 49,811
    E. Other current liabilities 0 0 0 0
    F. Accrued charges and deferred income 21,614 25,784 26,707 24,731
    Total current liabilities 522,270 407,308 532,211 401,854
    TOTAL LIABILITIES 2,815,727 2,595,910 2,796,191 2,376,470
    TOTAL EQUITY AND LIABILITIES 6,463,824 6,176,811 6,085,540 5,161,867
  • Download the EPRA key figures in excel

    31/12/2024

    31/12/2023

    31/12/2022

    EPRA Earnings (in €/share) 4.93 5.02 4.76
    EPRA NRV (in €/share) 86.46 84.17 91.74
    EPRA NTA (in €/share) 76.63 74.18 79.71
    EPRA NDV (in €/share) 77.19 75.41 83.92
    EPRA Net Initial Yield (NIY) (in %) 5.3 % 5.3 % 4.9 %
    EPRA Topped-up NIY (in %) 5.5 % 5.4 % 5.1 %
    EPRA Vacancy Rate (in %) 0.1 % 0.1 % 0.4 %
    EPRA Cost Ratio (including direct vacancy costs) (in %) 14.2 % 15.4 % 15.9 %
    EPRA Cost Ratio (excluding direct vacancy costs) (in %) 14.1 % 15.4 % 15.9 %


® Aedifica (RREC) Phone: +32 2 626 07 70 E-mail: info@aedifica.eu
  • Contact
  • Disclaimer
  • Privacy Policy
  • Cookie policy
  • Subscribe to our press releases

Get directions

Do you want to pay us a visit at the office? The coffee is ready, you are more than welcome.

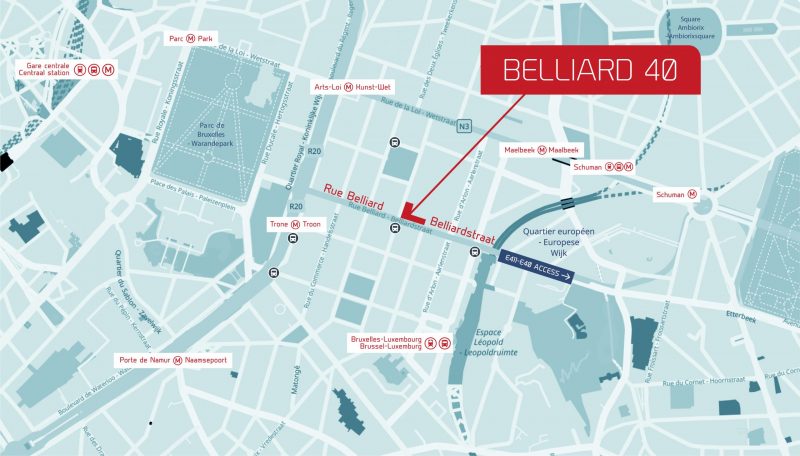
We have made sure that you can easily get to our head office in Brussels by public transport: you can reach us by train, metro, bus and bicycle.

If you come by train, you can get off at the station of Brussels-Luxemburg or Brussels-Central. From there you can easily continue on foot to rue Belliard 40. If you come by international train, you get off at Brussels-South station and take metro line 2 or 6 to Trône/Troon or Arts-Loi/Kunst-Wet.

If you come by metro, you can take line 1 or 5 to Arts-Loi/Kunst-Wet or Maelbeek/Maalbeek, or you can take line 2 or 6 to Trône/Troon or Arts-Loi/Kunst-Wet.

If you come by bus, you can take line 21, 27 and 64 to Trêves/Trier, or line 27, 34, 38, 64, 80 and 95 to Science/Wetenschap.

If you take a villo! sharing bike, you can easily park your bike in the Charlemagne/Karel De Grote bike station right in front of our office.

Of course, you can also reach us by car, but we encourage you to consider the environment and use public transport or other eco-friendly transportation options.

Our website uses different cookies for its technical and functional management (as set out in our Privacy Policy and Cookie Policy). You can adapt your cookie consent at any time via your browser settings. Your use of this website implies your consent to set cookies.
ACCEPT REFUSE
Privacy & Cookies Policy

Privacy Overview

This website uses cookies to improve your experience while you navigate through the website. Out of these cookies, the cookies that are categorized as necessary are stored on your browser as they are essential for the working of basic functionalities of the website. We also use third-party cookies that help us analyze and understand how you use this website. These cookies will be stored in your browser only with your consent. You also have the option to opt-out of these cookies. But opting out of some of these cookies may have an effect on your browsing experience.
Necessary
Always Enabled
Necessary cookies are absolutely essential for the website to function properly. This category only includes cookies that ensures basic functionalities and security features of the website. These cookies do not store any personal information.
Non-necessary
Any cookies that may not be particularly necessary for the website to function and is used specifically to collect user personal data via analytics, ads, other embedded contents are termed as non-necessary cookies. It is mandatory to procure user consent prior to running these cookies on your website.
SAVE & ACCEPT